




Lesson starter (slides 1-3)
Burning fossil fuels uses oxygen and emits carbon dioxide. Pose the question: What else do you know of takes in oxygen and releases carbon dioxide? Students should be able to identify that humans and animals breathe out oxygen and release carbon dioxide.
Respiration emits carbon dioxide
Slides 4-12: Review the components of the CO2 sensor (slides 4-5) and use students’ prior knowledge to ask what will happen when someone breathes on the CO2 sensor.
We recommend having a chart similar to the one on below (slide 6) on a whiteboard or a piece of chart paper that you can refer to and fill in as the class progresses. Record the reading of the sensor for the first time in the table.
Example:
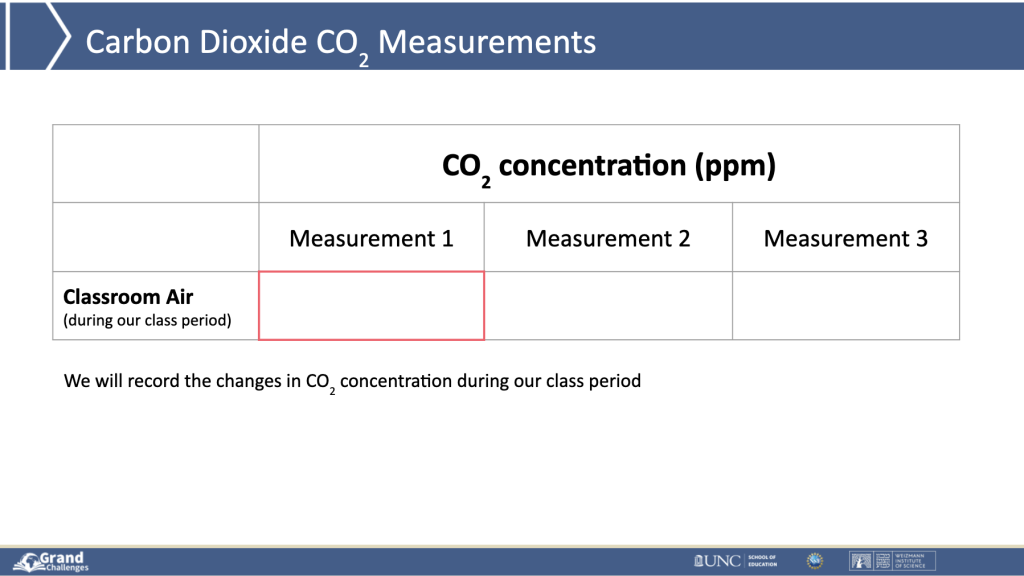
Inform the class that we will be recording the changes in CO2 concentration in our classroom during this class. Ask the class what they predict will happen as the class goes on.
We expect students to know that the CO2 concentration will increase, so move on to slide 9 to demonstrate why that might be.
Check the CO2 sensor again because, at this point, it has had time to read the correct level. (slide 10)
Let’s get moving:
The activity on slide 11 is to have students move around before checking the CO2 sensor again.
Check the CO2 sensor for a third time (slide 12): After the rock, paper, scissors activity, check the CO2 sensor a final time. Ask students about what conclusions we can draw from the data.
Students should be able to say that the CO2 concentration went up, especially when we were moving around.
This means that humans contribute to the concentration of CO2 in the atmosphere by breathing.
Adding to our models:
Using the data and conclusion you just reached from the CO2 sensor, ask students how they can represent this new piece in their models.
Students will then draw an arrow from the cows to the CO2 circle (slide 14)

Slide 15 helps you transition to the next part of the lesson: Do we know any processes that absorb CO2?
Next, we are going to collect data on what happens when we place spinach leaves in a gallon bag with the CO2 sensor and access to sunlight.
Procedures
Add a row to your previous chart, example below (slide 17), and record your initial CO2 concentration.
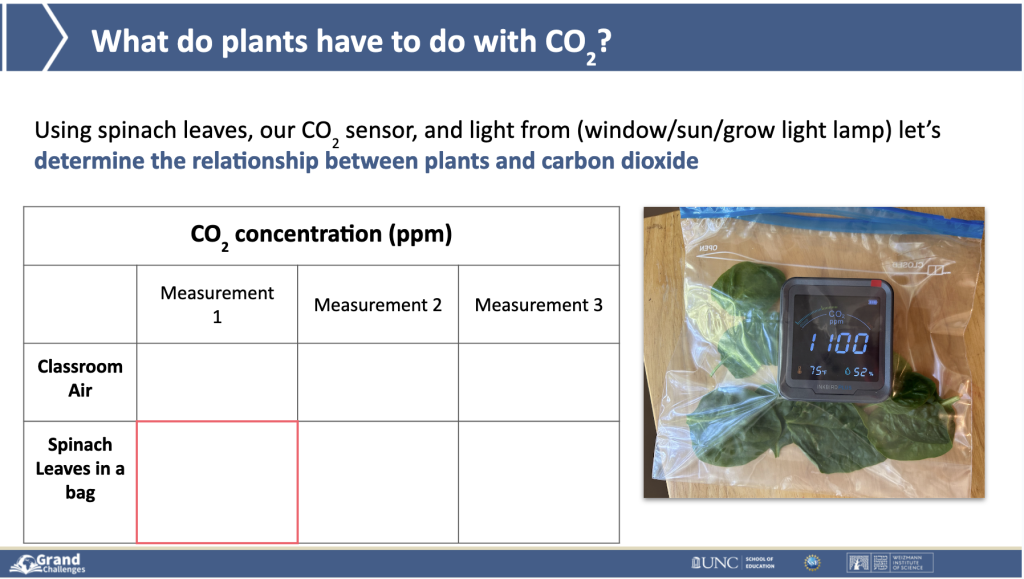
Have students predict what they think will happen to the CO2 concentration. (slide 18)
Check the CO2 again (slide 19)
While waiting before the final CO2 check, students can use this time (~10 minutes) to tell the story of oil. The cards are in the correct order in the slides, so be sure to mix them up before giving them to students.
Check the CO2 sensor a final time
Ask students if their predictions were correct (slide 22). We expect them to be correct, so use students’ prior knowledge that led them to make a correct prediction to ask what it is that plants are doing that caused the CO2 concentration to decrease (slide 23).
Ask the students, “what did we put in to the system and what did we get out?” (slide 24)
We expect students to come up with the following:
Then ask students what else we know that plants need to really grow (slide 25). And add water to the picture (slide 26).
Lastly, tell students that photosynthesis also produces carbon compounds, which the plants use to grow in size (slide 27).
Closing
Slide 28: Have students summarize the relationship between the two processes explored today.
Example sentences:
Animals and plants have opposite processes that affect the CO2 concentration differently. Humans and animals breathe in oxygen and out carbon dioxide, which contributes to the CO2 concentration in the atmosphere. Plants take in carbon dioxide and release oxygen, which reduces the CO2 concentration in the atmosphere.
Summarize that the processes are opposite, and have students add photosynthesis to their models.